
Twenty seventh day.
Hello Traders!
This trilogy is devoted to the daily routine of professional traders, in which beginners or those interested in trading will understand, what real trading is! You will see how much effort the specialist gives to understand the internal structure of the market.
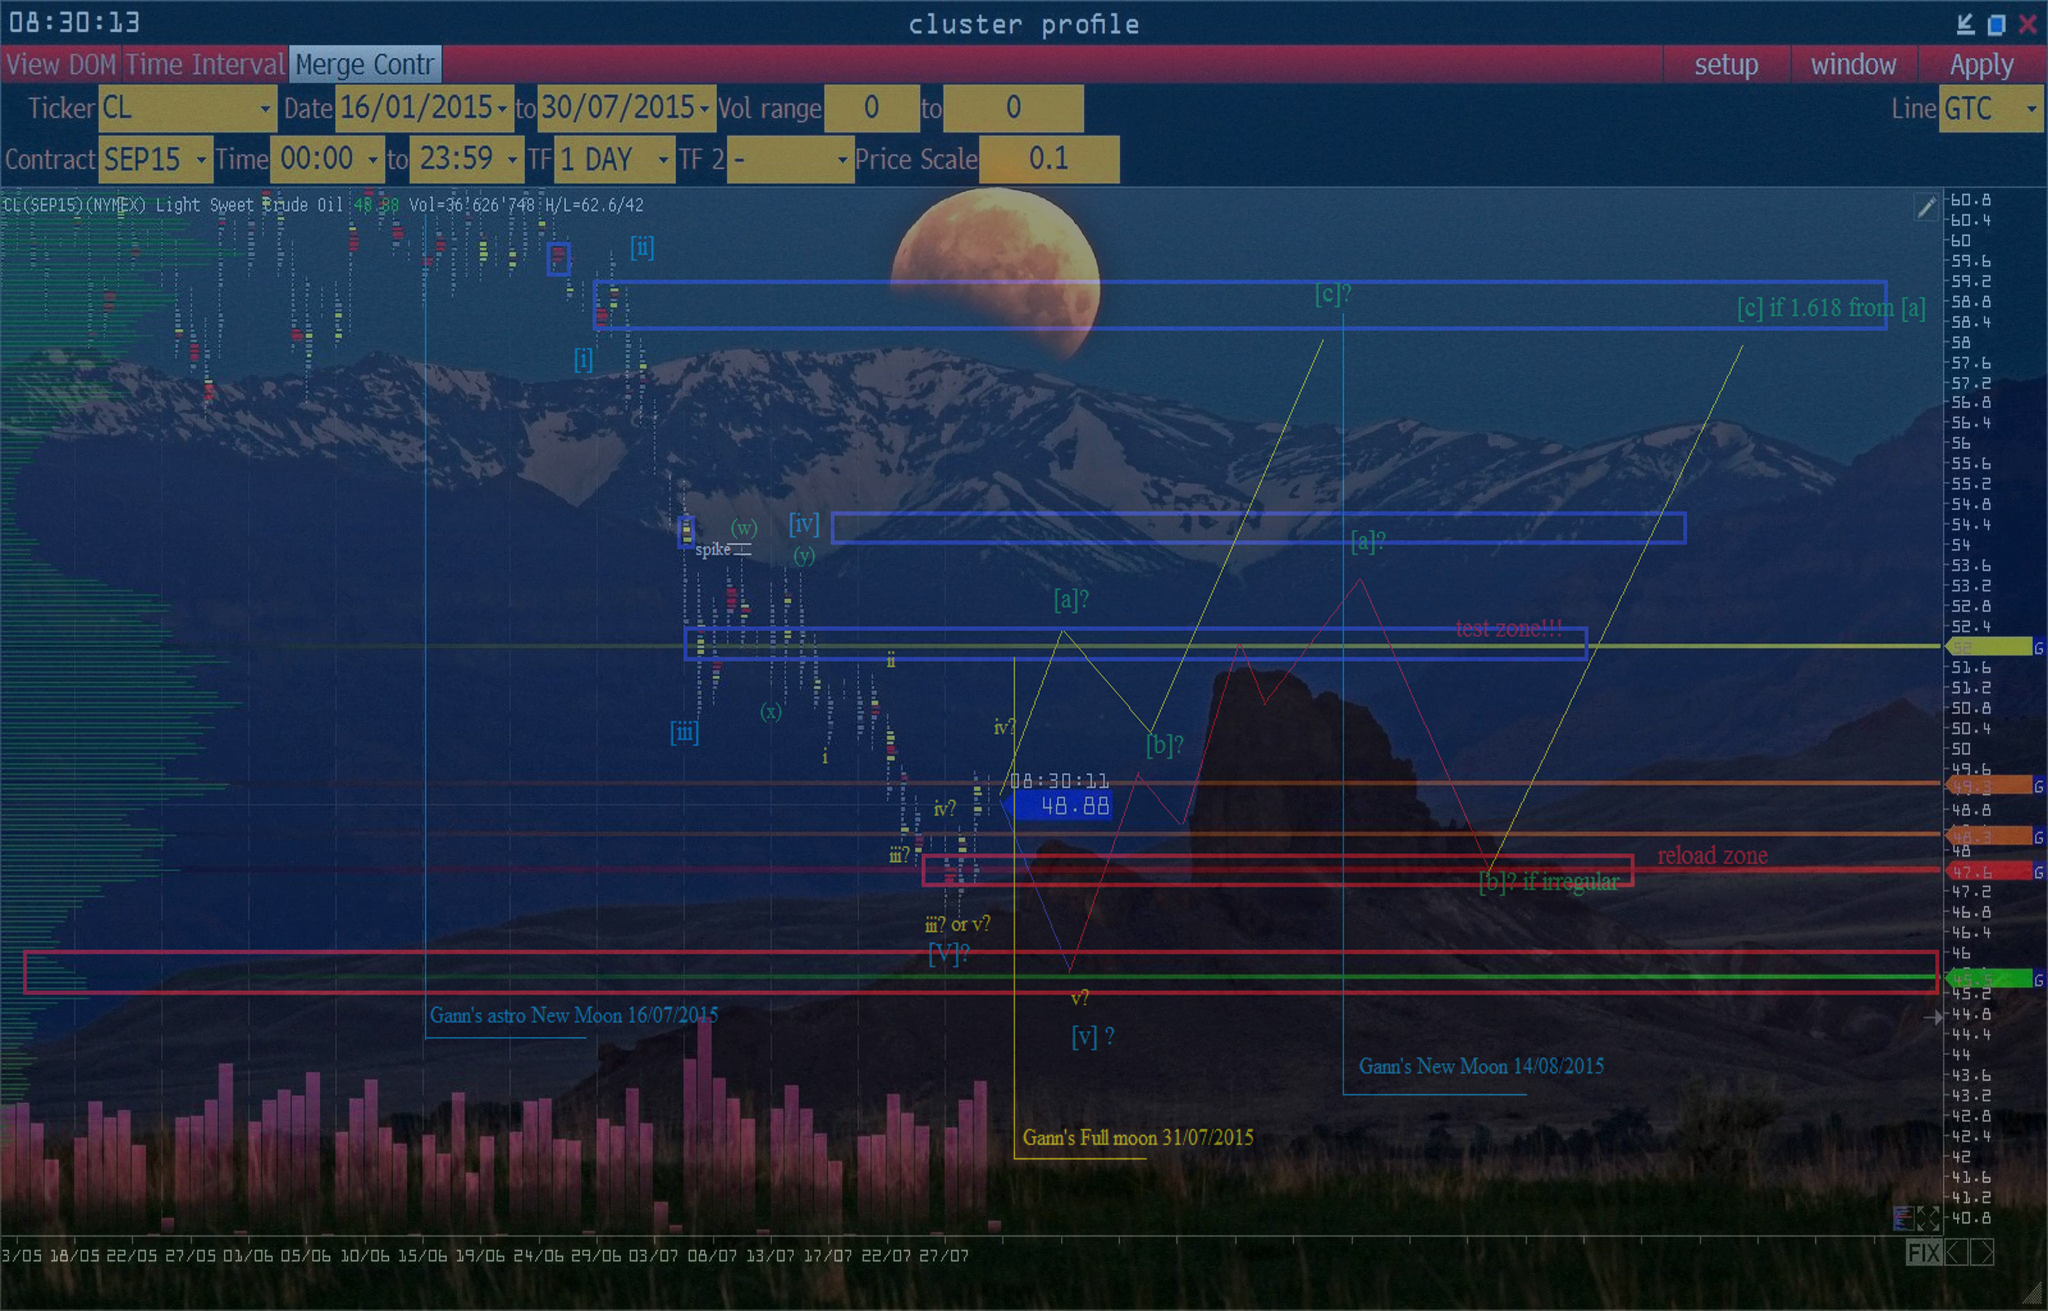
So, let’s begin! In the first part of the video, the trader tries to determine
several variations in price movement using Historical Chart within the Wave Theory of R.N. Elliott
Part II: Having examined 4 variants of price movement by EWA/EWP, the picture gives a clear understanding of the bullish trend at the current moment. Now the trader is trying to adapt the architecture of wave counters of historical charts to a 5-minute chart projection of the price.
Part III: The final part of the analysis is necessary to find the place of high-precision entry into the market! All balances are checked, beginning with the monthly timeframe ending with a 15-minute timeframe. Now on the basis of this analytics, you will be able to understand what you will learn, at the trading courses of the team “Powerful Traders”
Enjoy watching.
Notice!
This is the professional Trader’s blog, specializing on Elliotte wave theory, Technichal analysis, Volume Spread analysis, Market Profile, Depth of Market, Order flow & Footprint.
We trade in all financial markets, there are no boundaries or limitations.
We wish all of you successful trades and profits!
Kind regards, Team traders “Powerful Traders”
Remember, trading is always risk!
Full Risk Disclosure: